Features
In the order you'll meet them: open a cluster, look at a list, open a thing, act on it — then the plumbing that makes it work.
Every kind, two ways to find it.
The sidebar has two taxonomies of the same catalog. Workloads groups things the way every desktop client does, so nothing moves on day one. API groups mirrors kubectl api-resources, with the exact command as each link's tooltip. Toggle between them; nothing refetches.
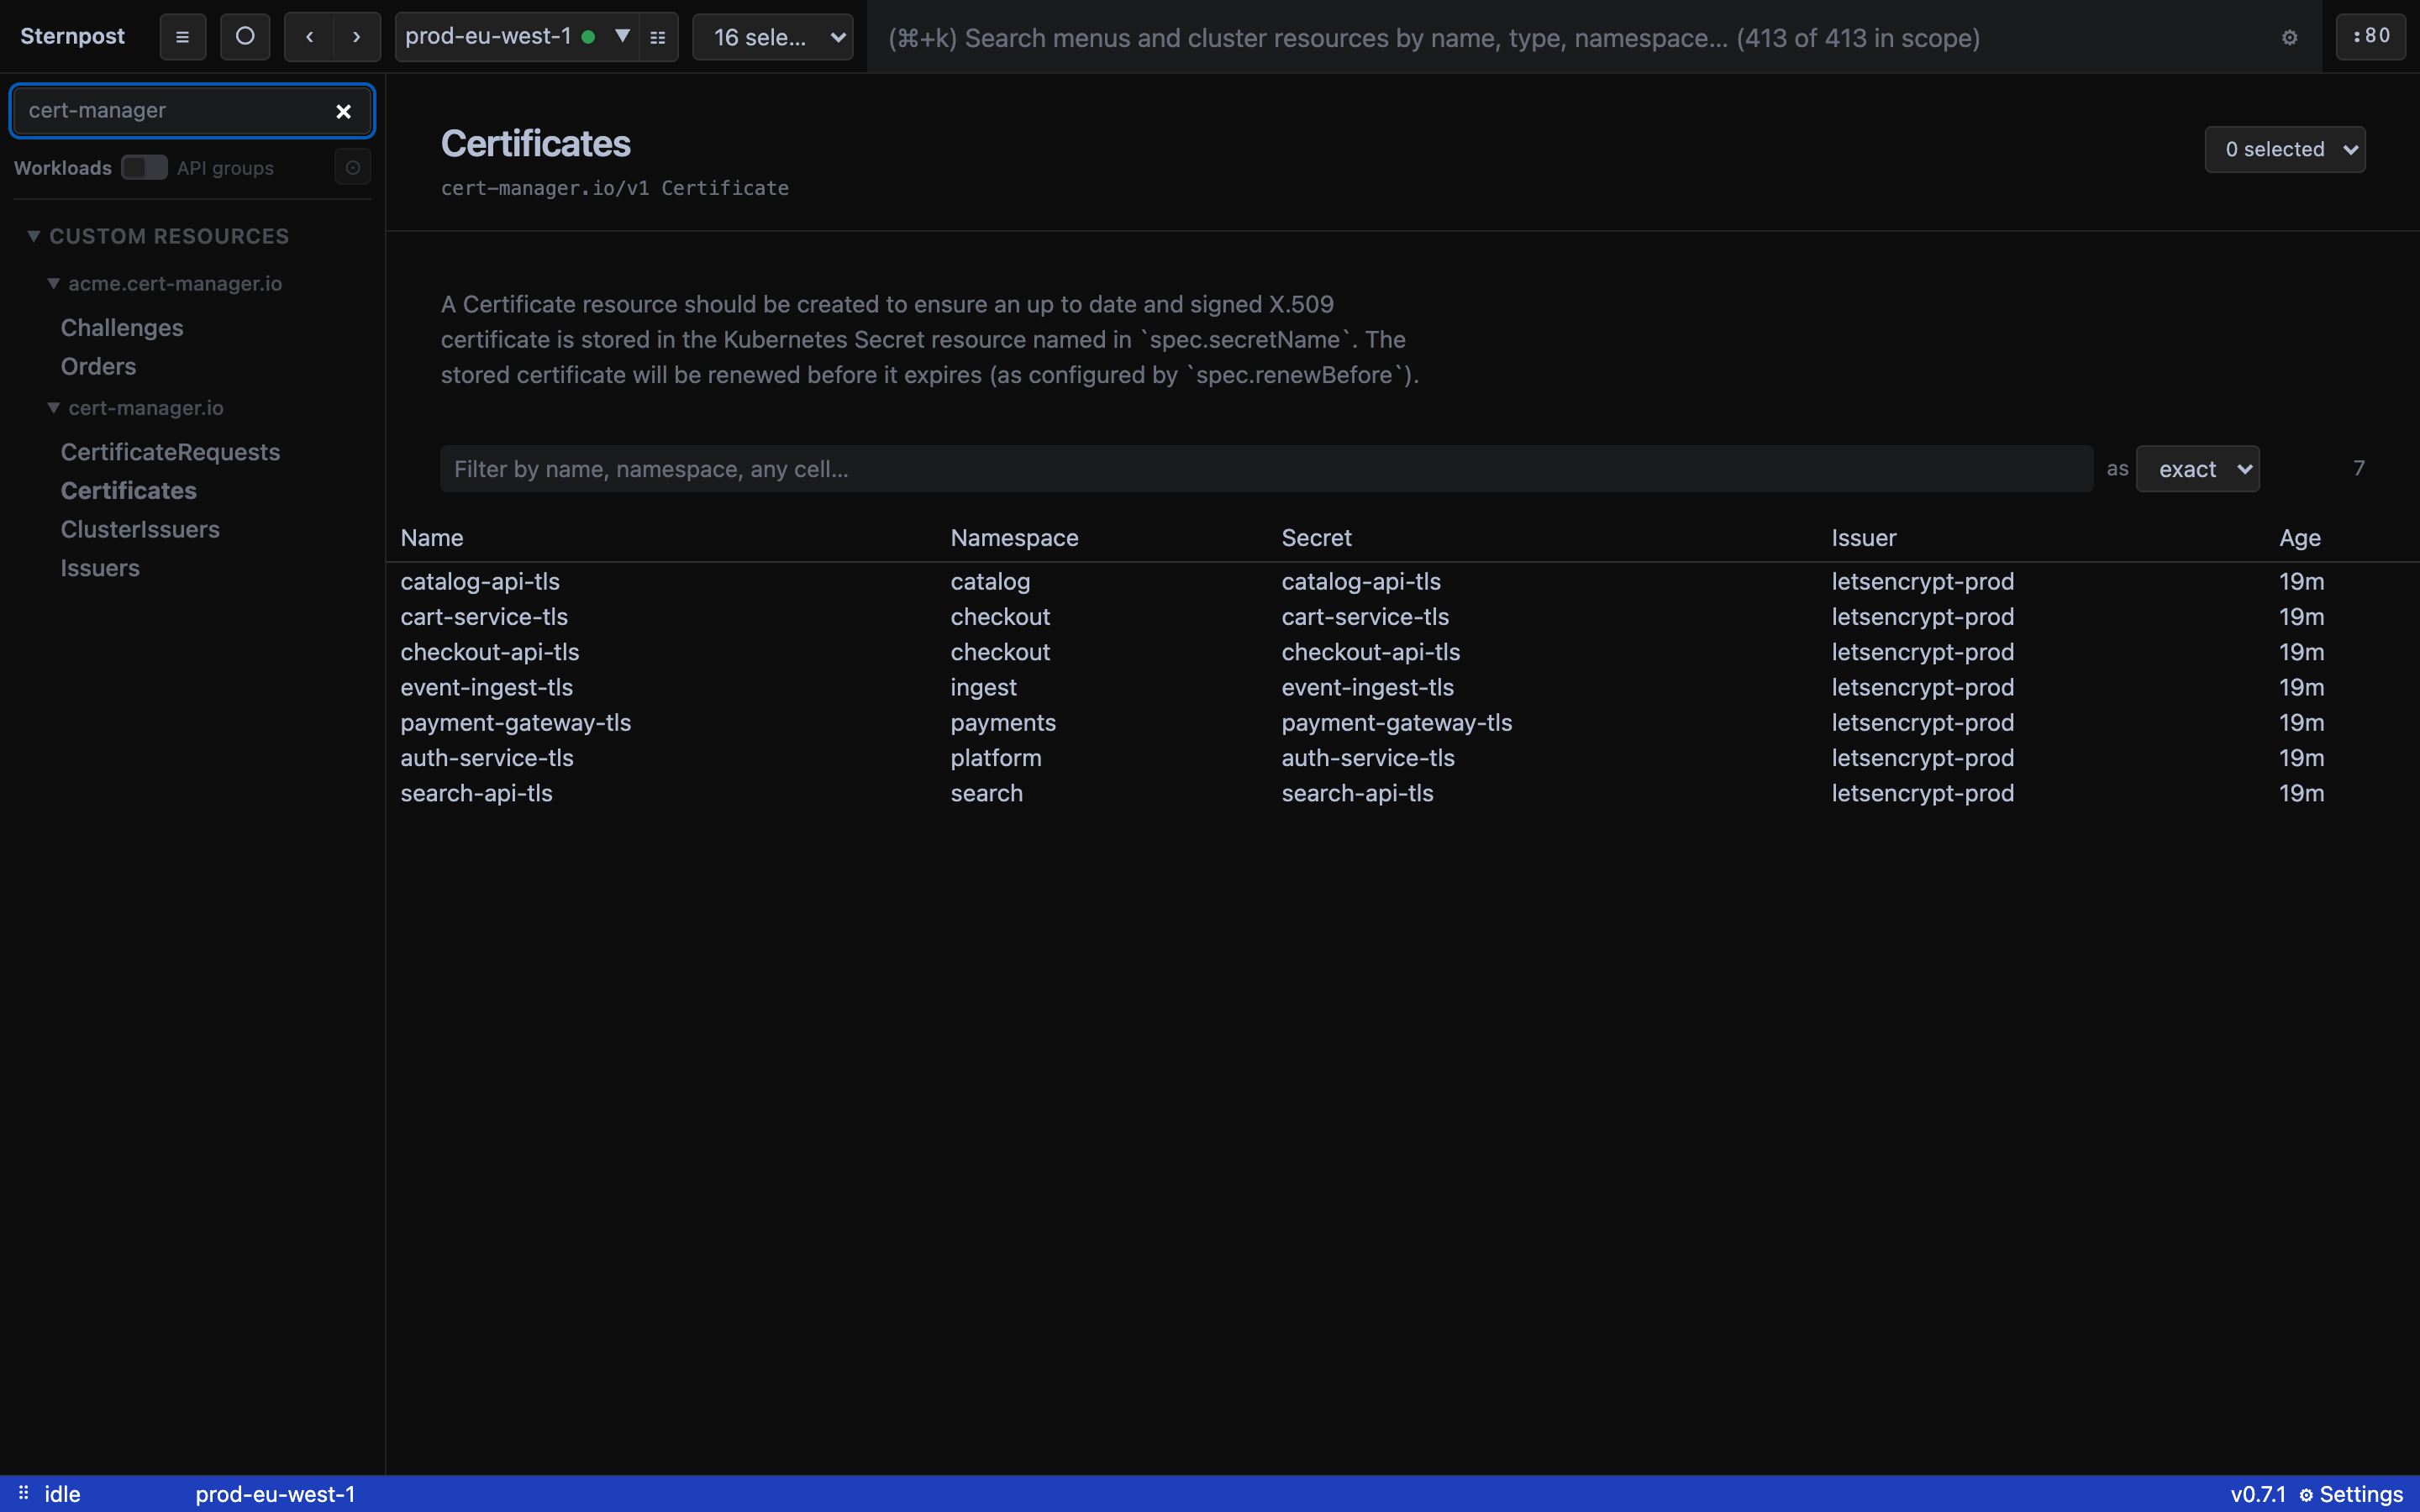
Type in the sidebar to narrow it. Fuzzy, prefix-aware, and it matches group names too — cert-manager.io keeps that whole section. The order never changes under you.
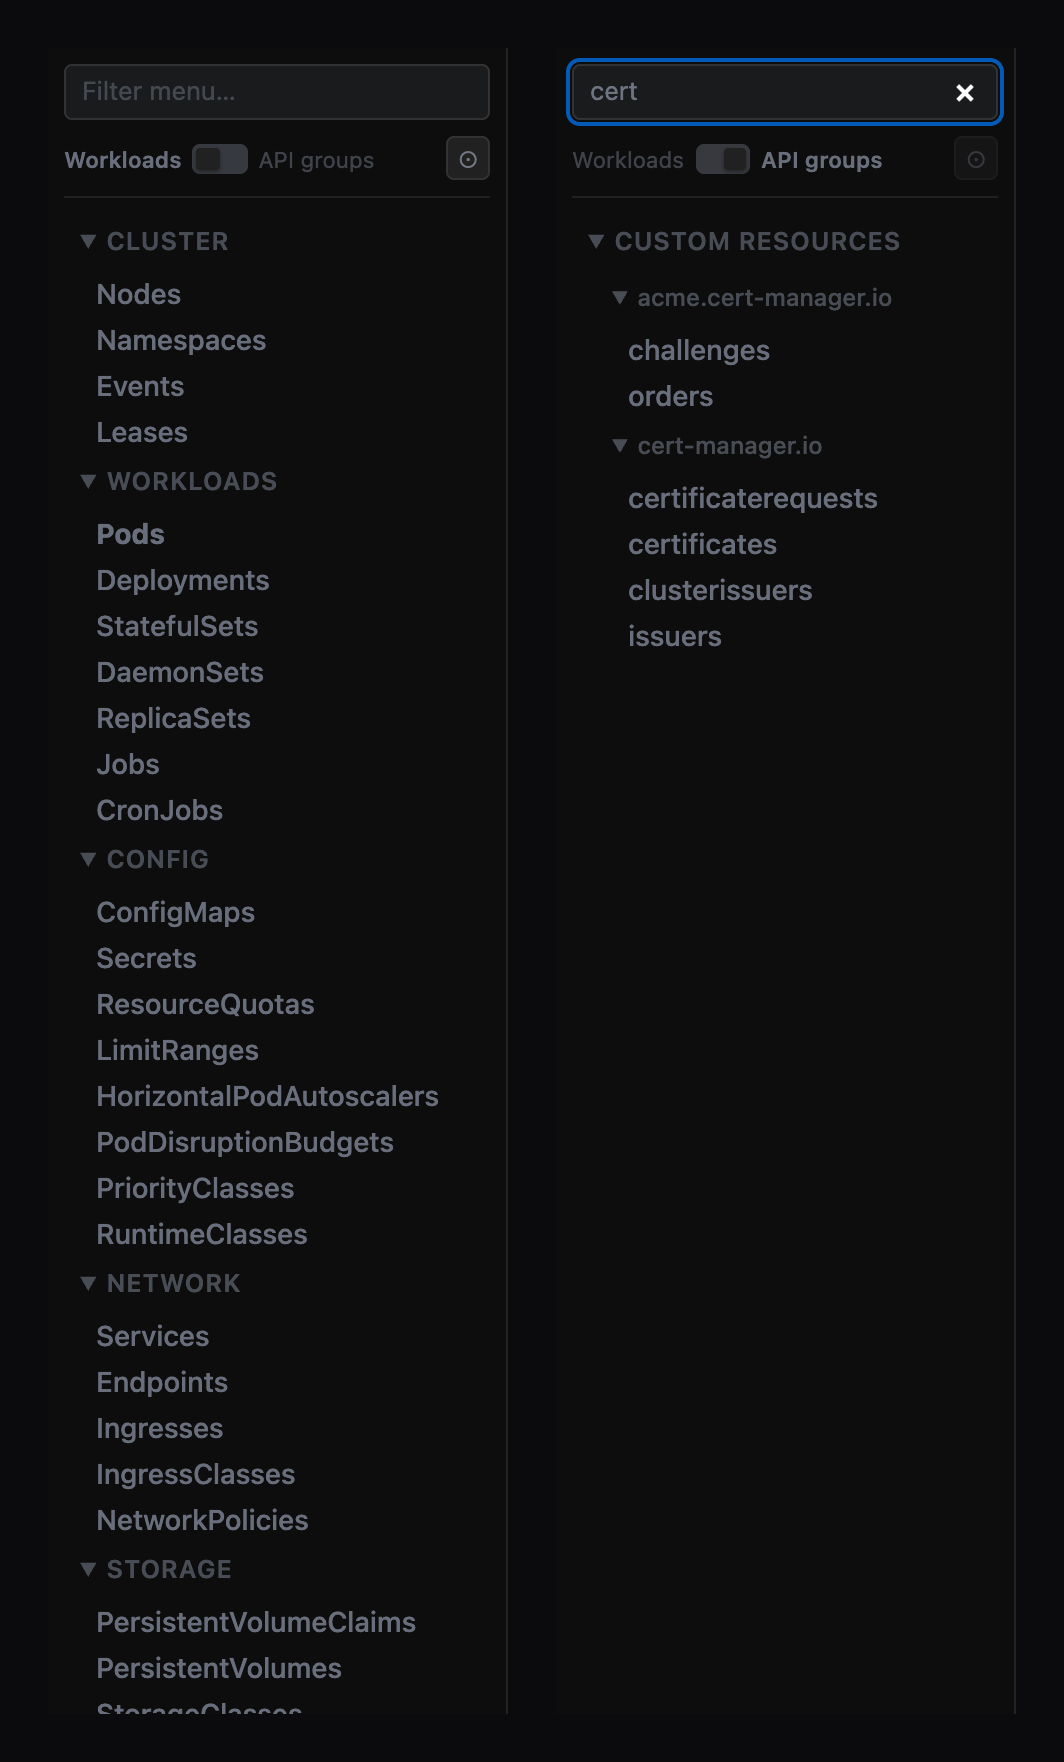
Your operators' types, without a plugin.
Sternpost knows the ~35 kinds every cluster has. It cannot know that yours also serves Orders, Applications and RabbitmqClusters — so it asks on connect and adds them to the sidebar, one group per API group, in both taxonomies.
Columns come from the CRD's own additionalPrinterColumns — what the operator's author decided matters, including the ones kubectl hides behind -o wide. The detail page walks the spec and status and hangs the CRD's schema off each row as a tooltip, which is usually the only documentation those types have.
And it follows the pointers. An Order says it's controlled by its CertificateRequest; a Certificate links to its Secret and its ClusterIssuer; a Pod that Argo created says so. Only when the link would be right — a wrong link is worse than none.
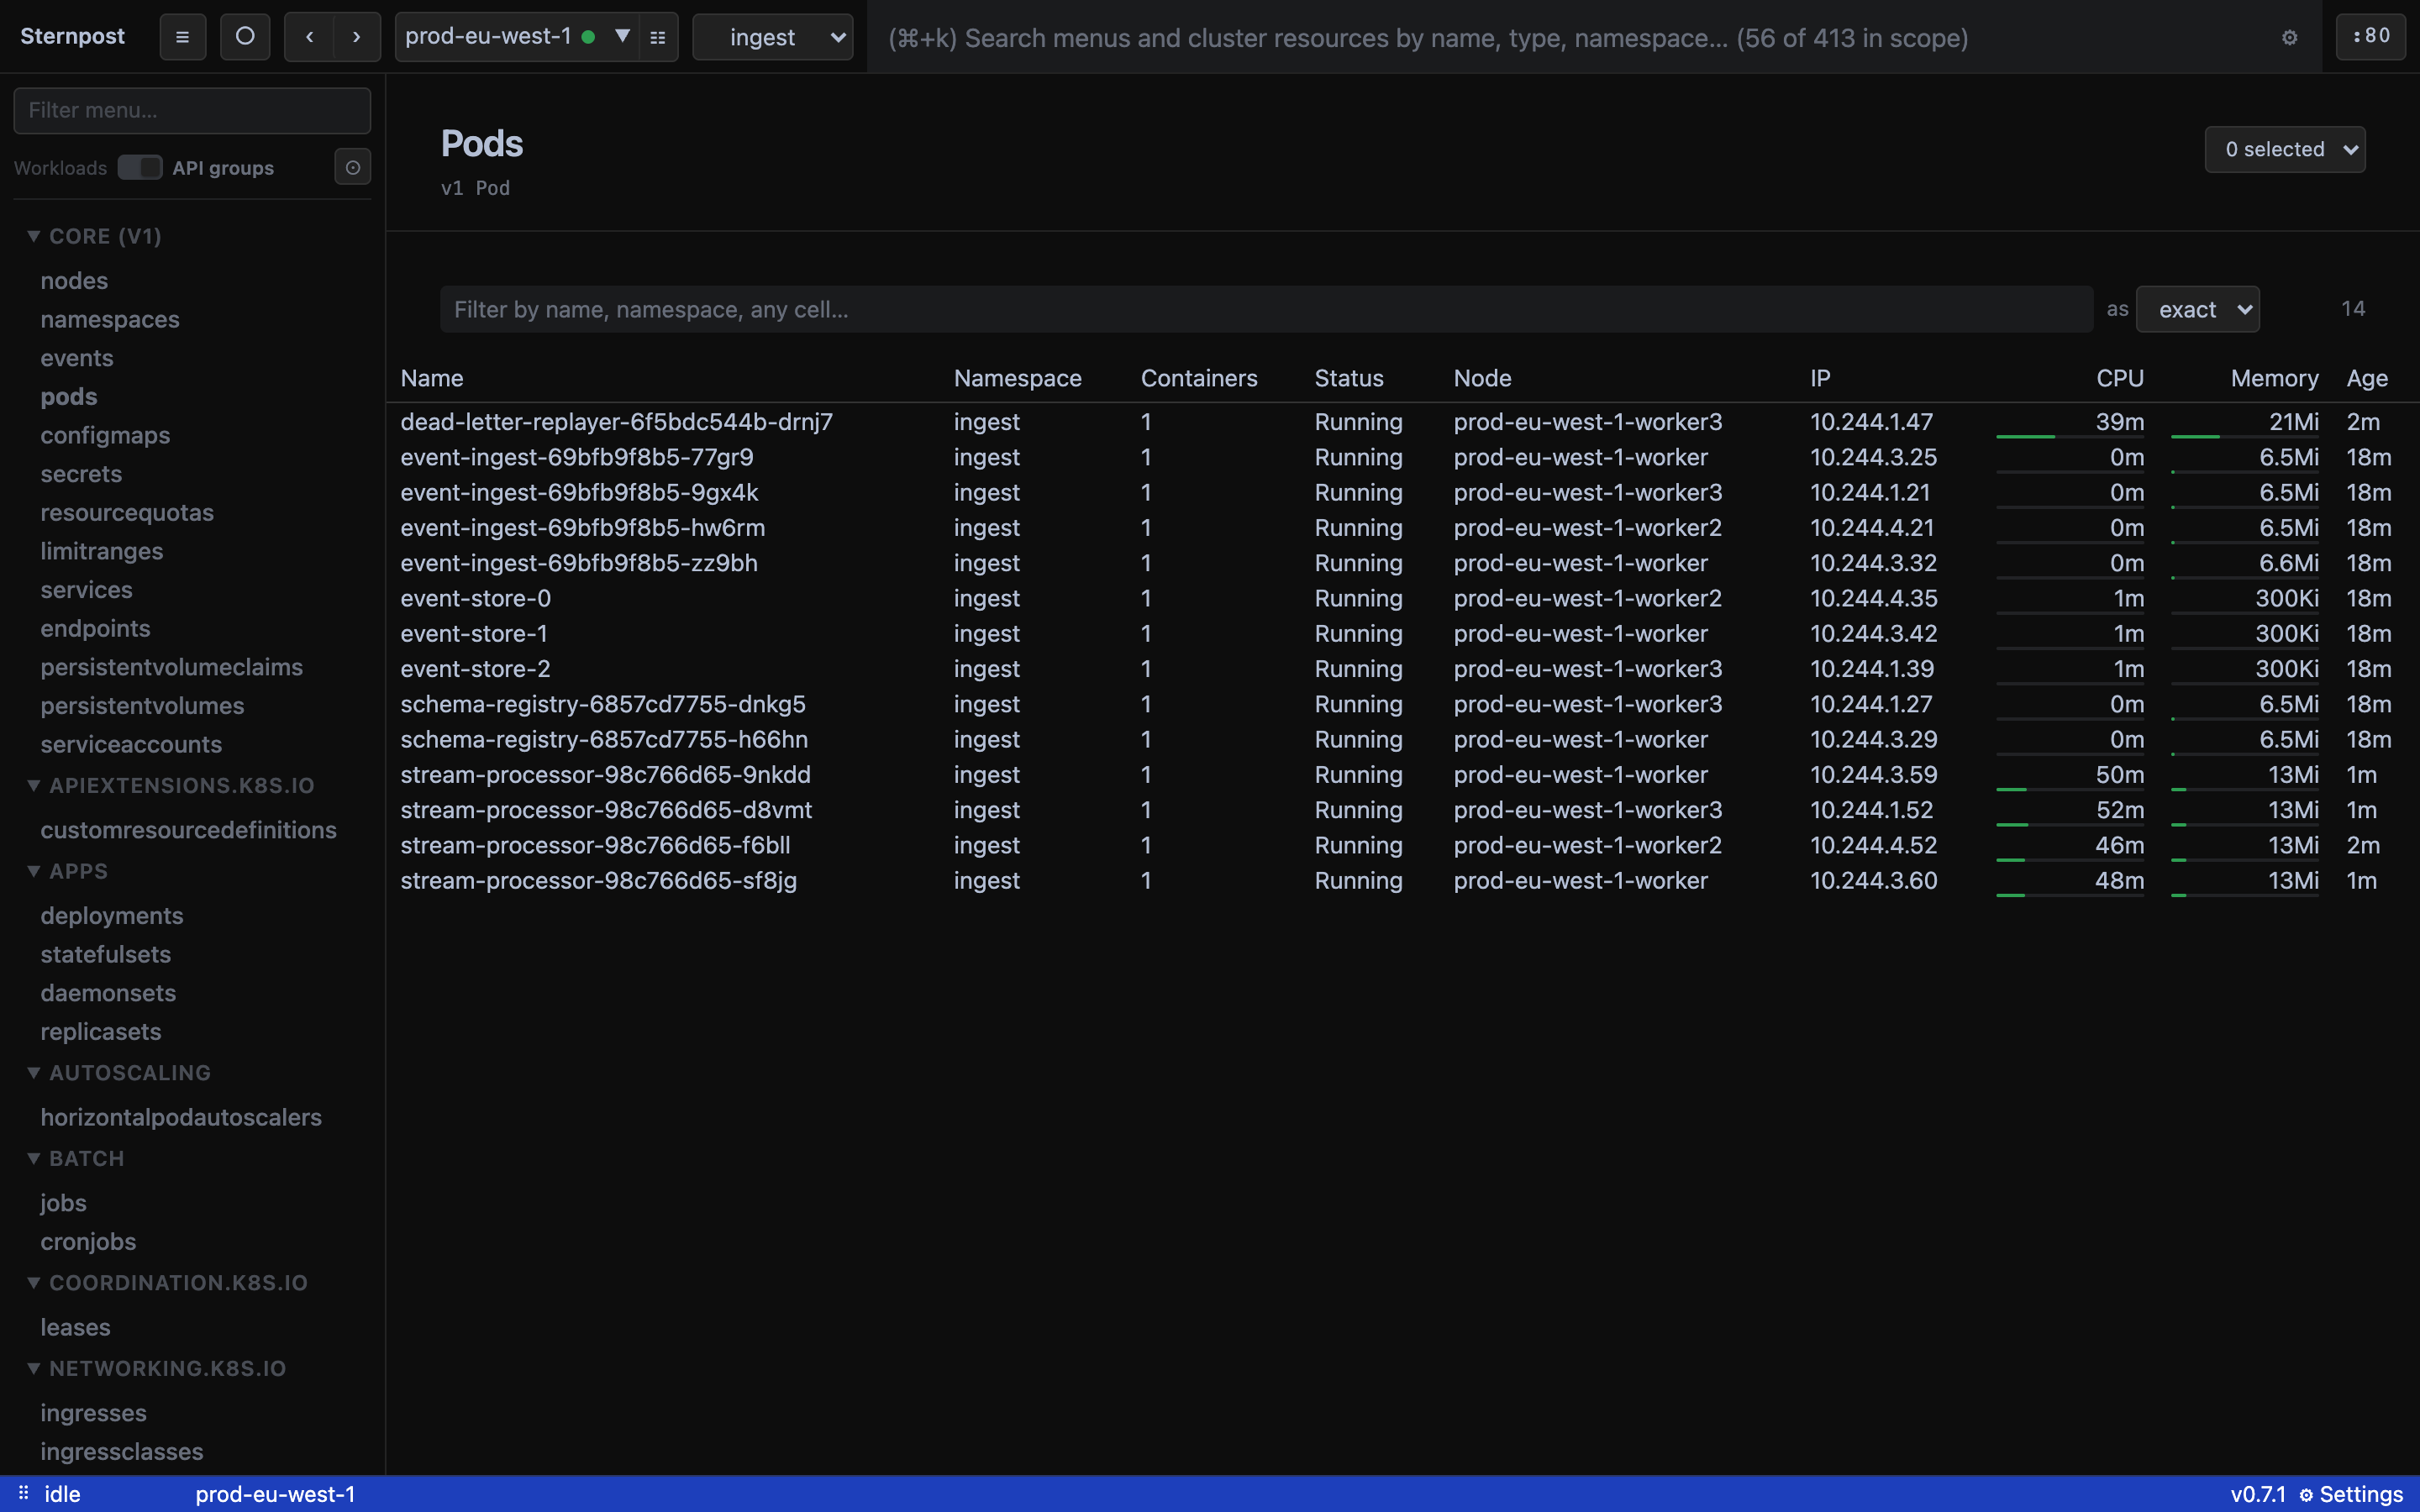
Watches, not polling.
Kubernetes has native subscriptions, so Sternpost uses them: list once, then hold a watch and apply changes as they arrive. kubectl get -w is a thin wrapper over the same endpoint — Sternpost speaks it directly rather than shelling out.
When a watch drops — network, expired credentials — it reconnects with backoff and says so. Watches start when you first look at a kind and are dropped after five minutes idle, so the app doesn't pay for what you're not looking at.
One word on how it's doing.
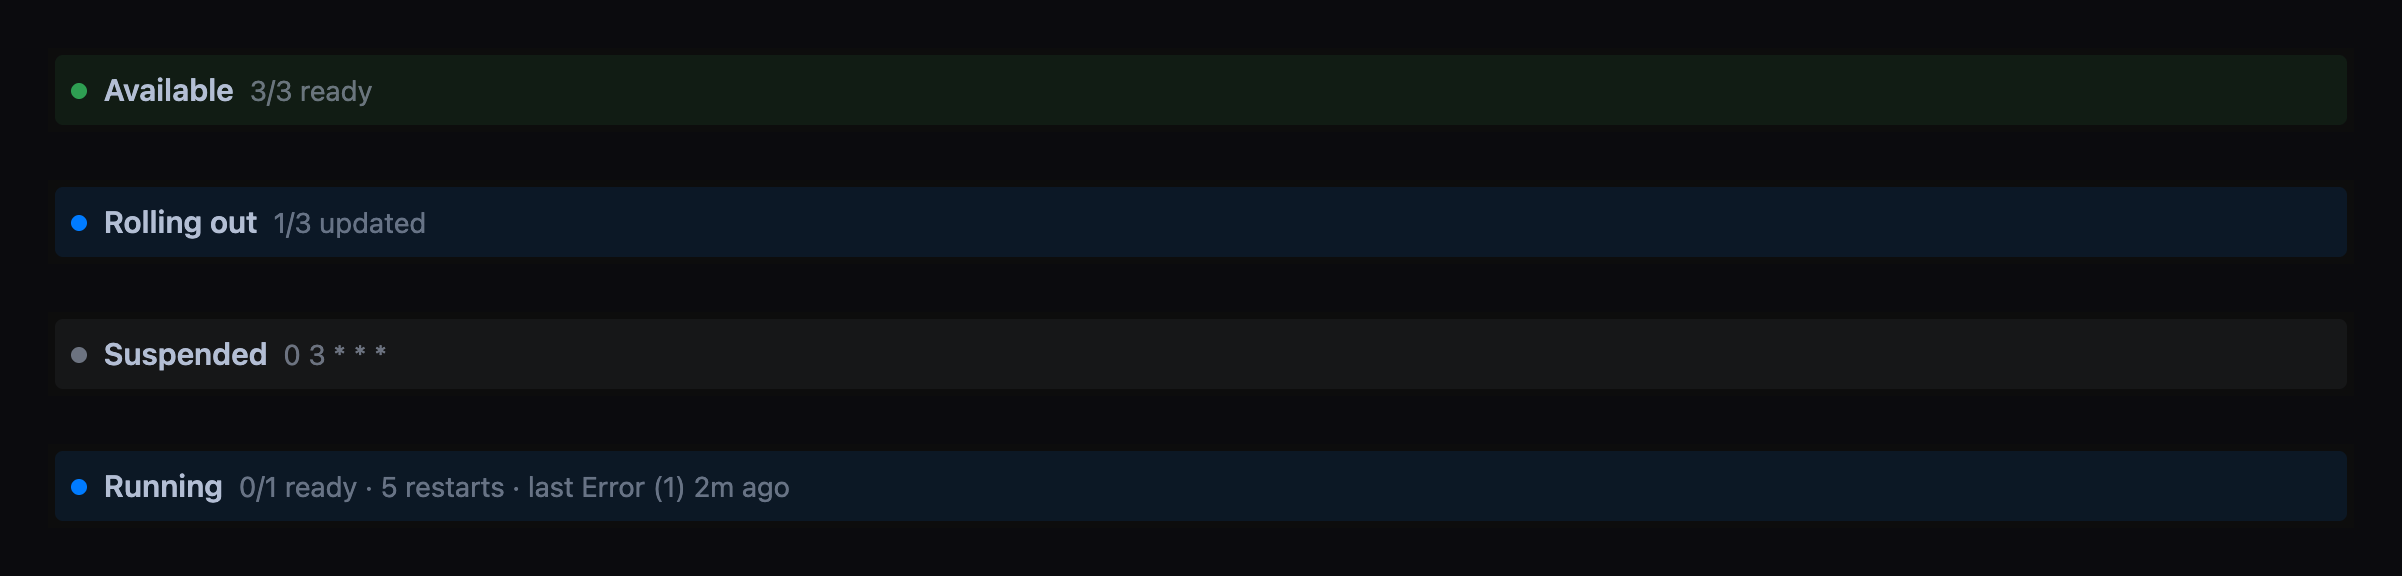
Every detail page opens with a word — Running, Rolling out 2/3 updated, Complete, Failed, CrashLoopBackOff, Cordoned, Suspended — the number behind it, and a dot in the matching tone. Chosen to match what kubectl rollout status and kubectl get would say. Conditions took three rows of True (MinimumReplicasAvailable) to say "Available".
It's the one part of the page that's live on its own: it refetches its word on every change to the cluster, without re-reading the rest of the page.
A Deployment's logs, not a pod's.
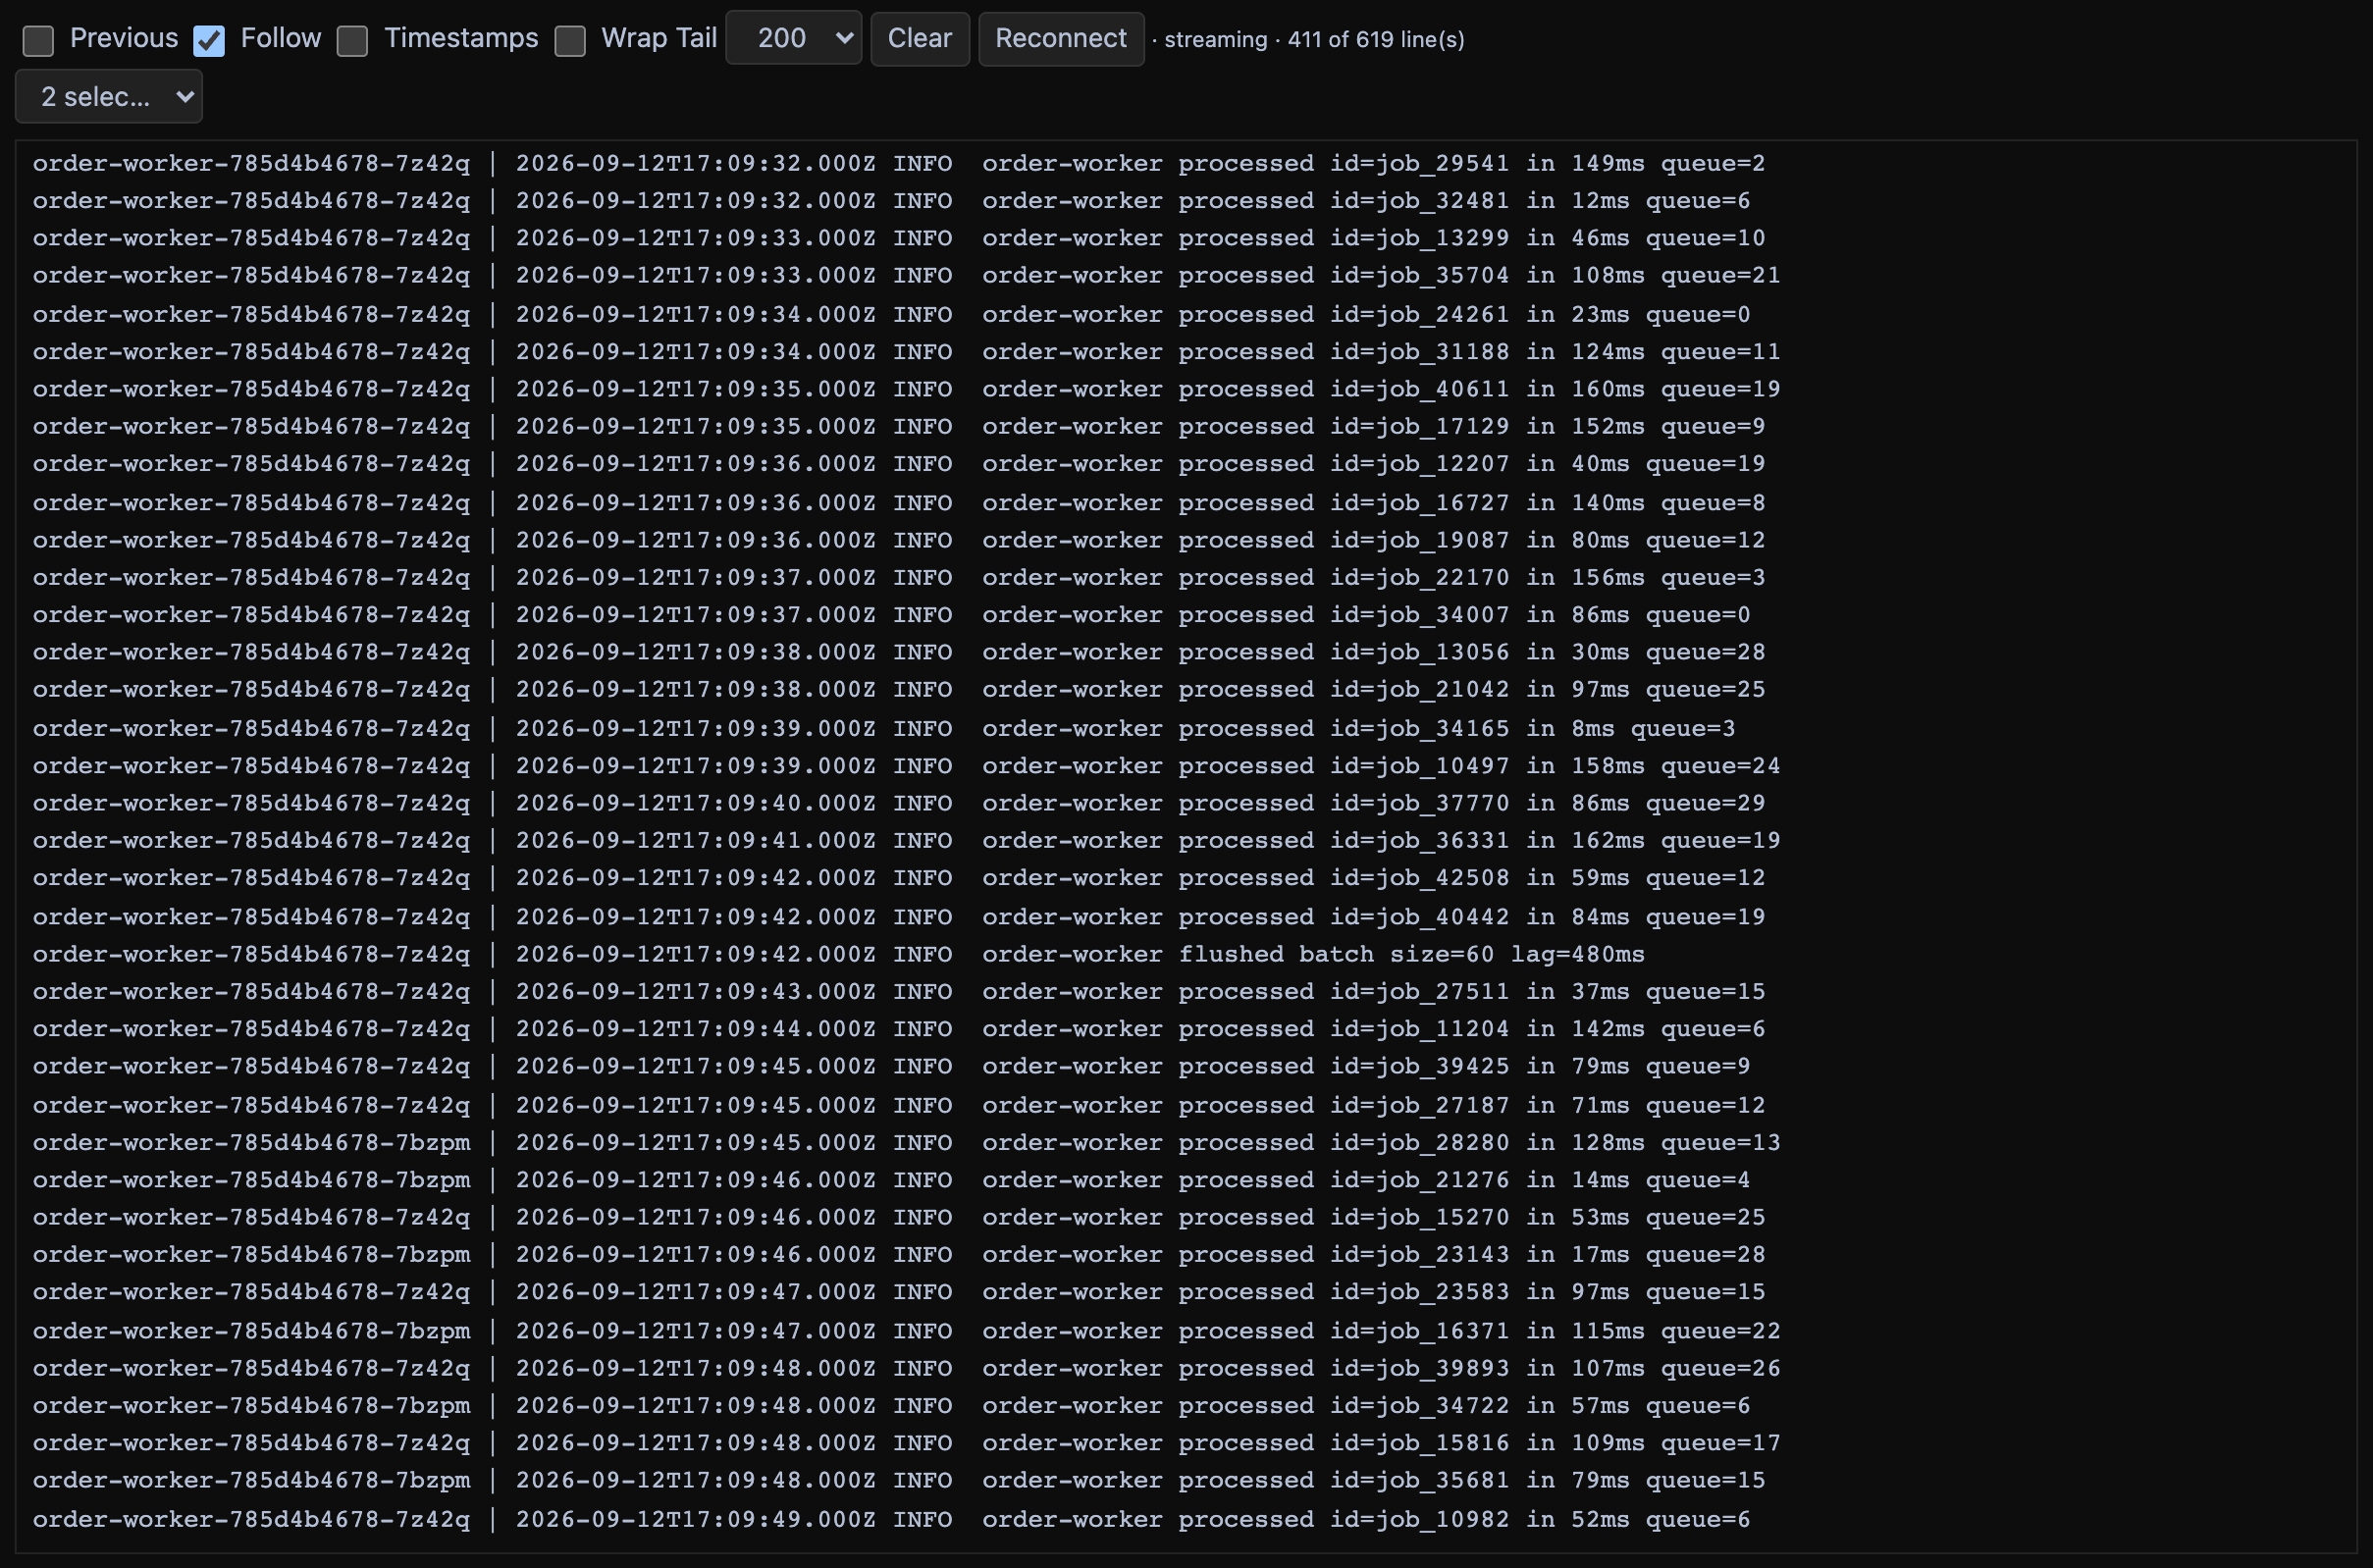
Open a Deployment, StatefulSet, DaemonSet, ReplicaSet or Job and get the logs of every pod behind it, merged, each line tagged with the pod it came from. Mute a pod and the lines already on screen filter too. Up to twenty pods per stream.
Streams by default, from the API server's follow endpoint. Autoscroll follows only if you were already at the bottom — it never yanks you back down while you're reading. Five thousand lines are kept.
Open in window puts the log in its own window with no sidebar and no search bar, so it can live on the other monitor.
A shell in the container.
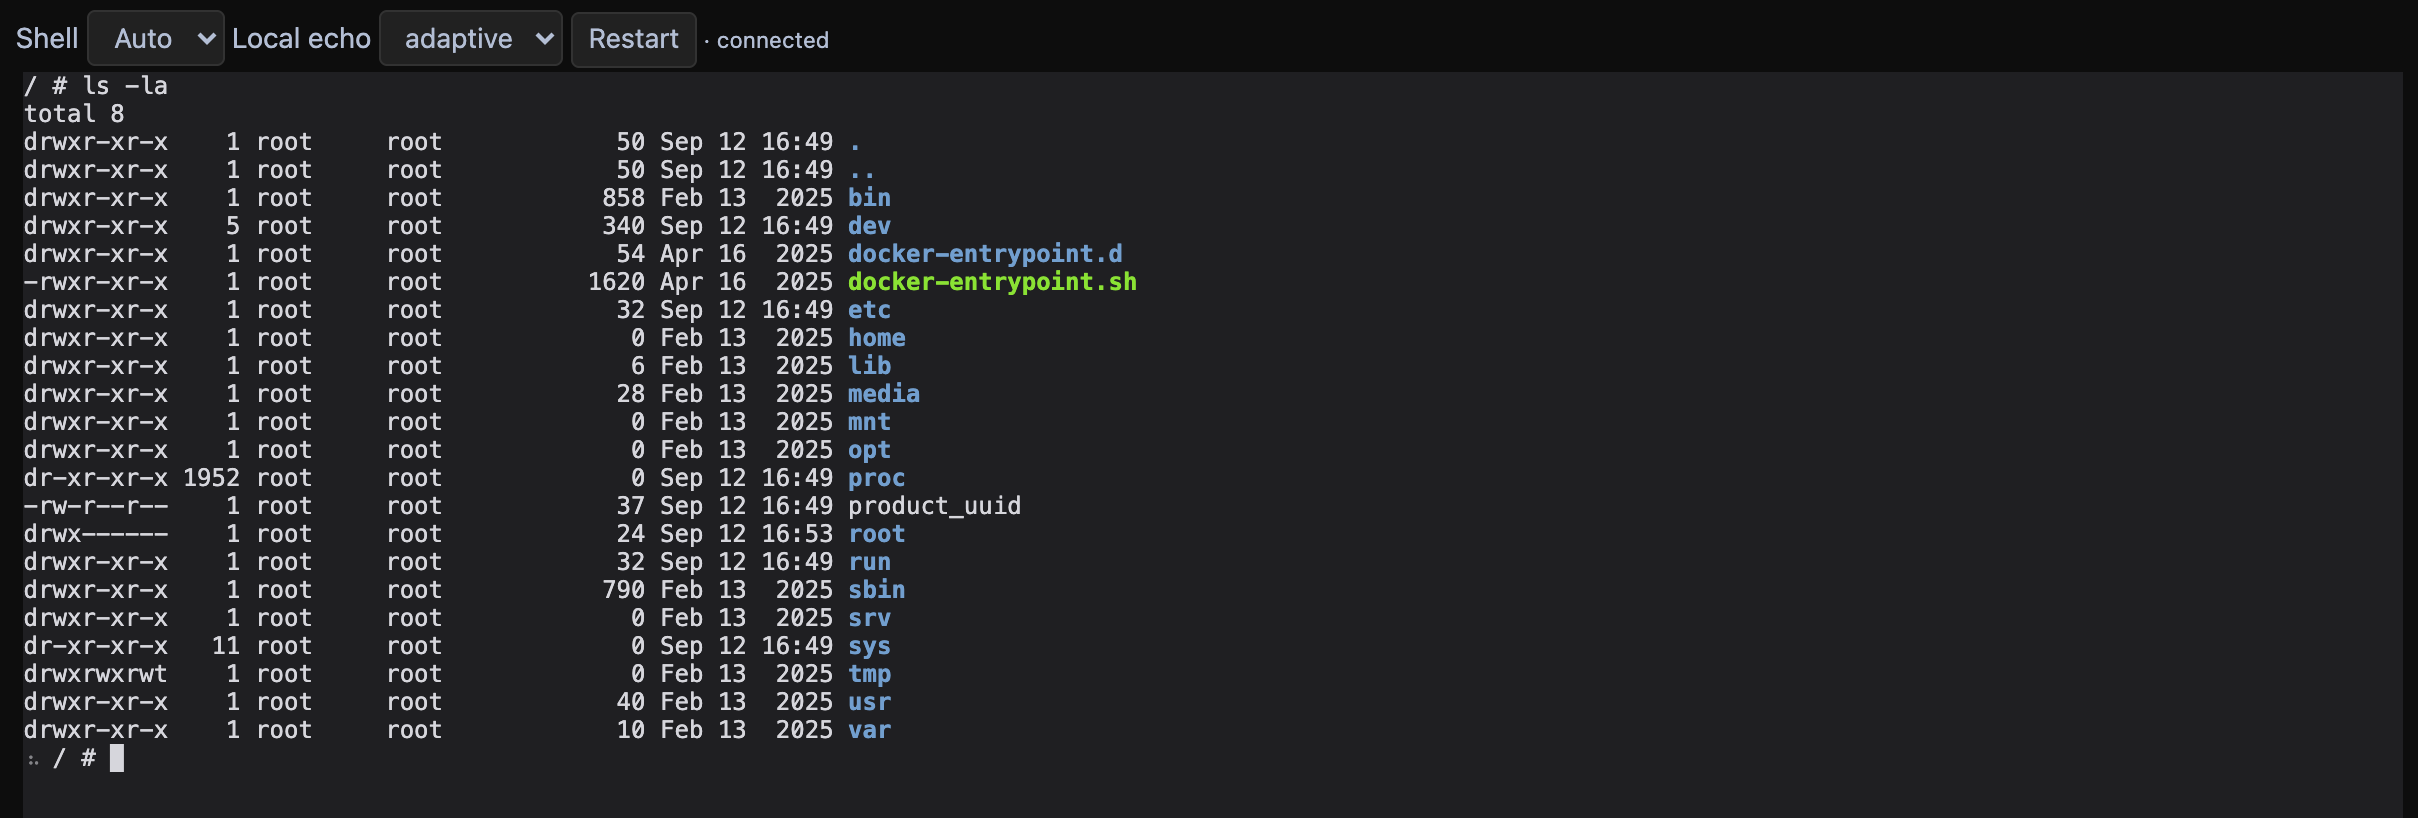
The second tab on a pod: a terminal over the API server's exec endpoint. No kubectl on PATH, auth from your kubeconfig, so exec plugins work here too.
Auto finds bash, then ash, then sh. Or pick one. Whichever it is, you get a prompt with the shell-integration mark iTerm2 and VS Code use, so your terminal knows where each command starts.
Multi-byte characters that straddle frames, keystrokes that must not reorder, a tab switch that must not kill the shell — handled.
Port forwards that survive a rollout.
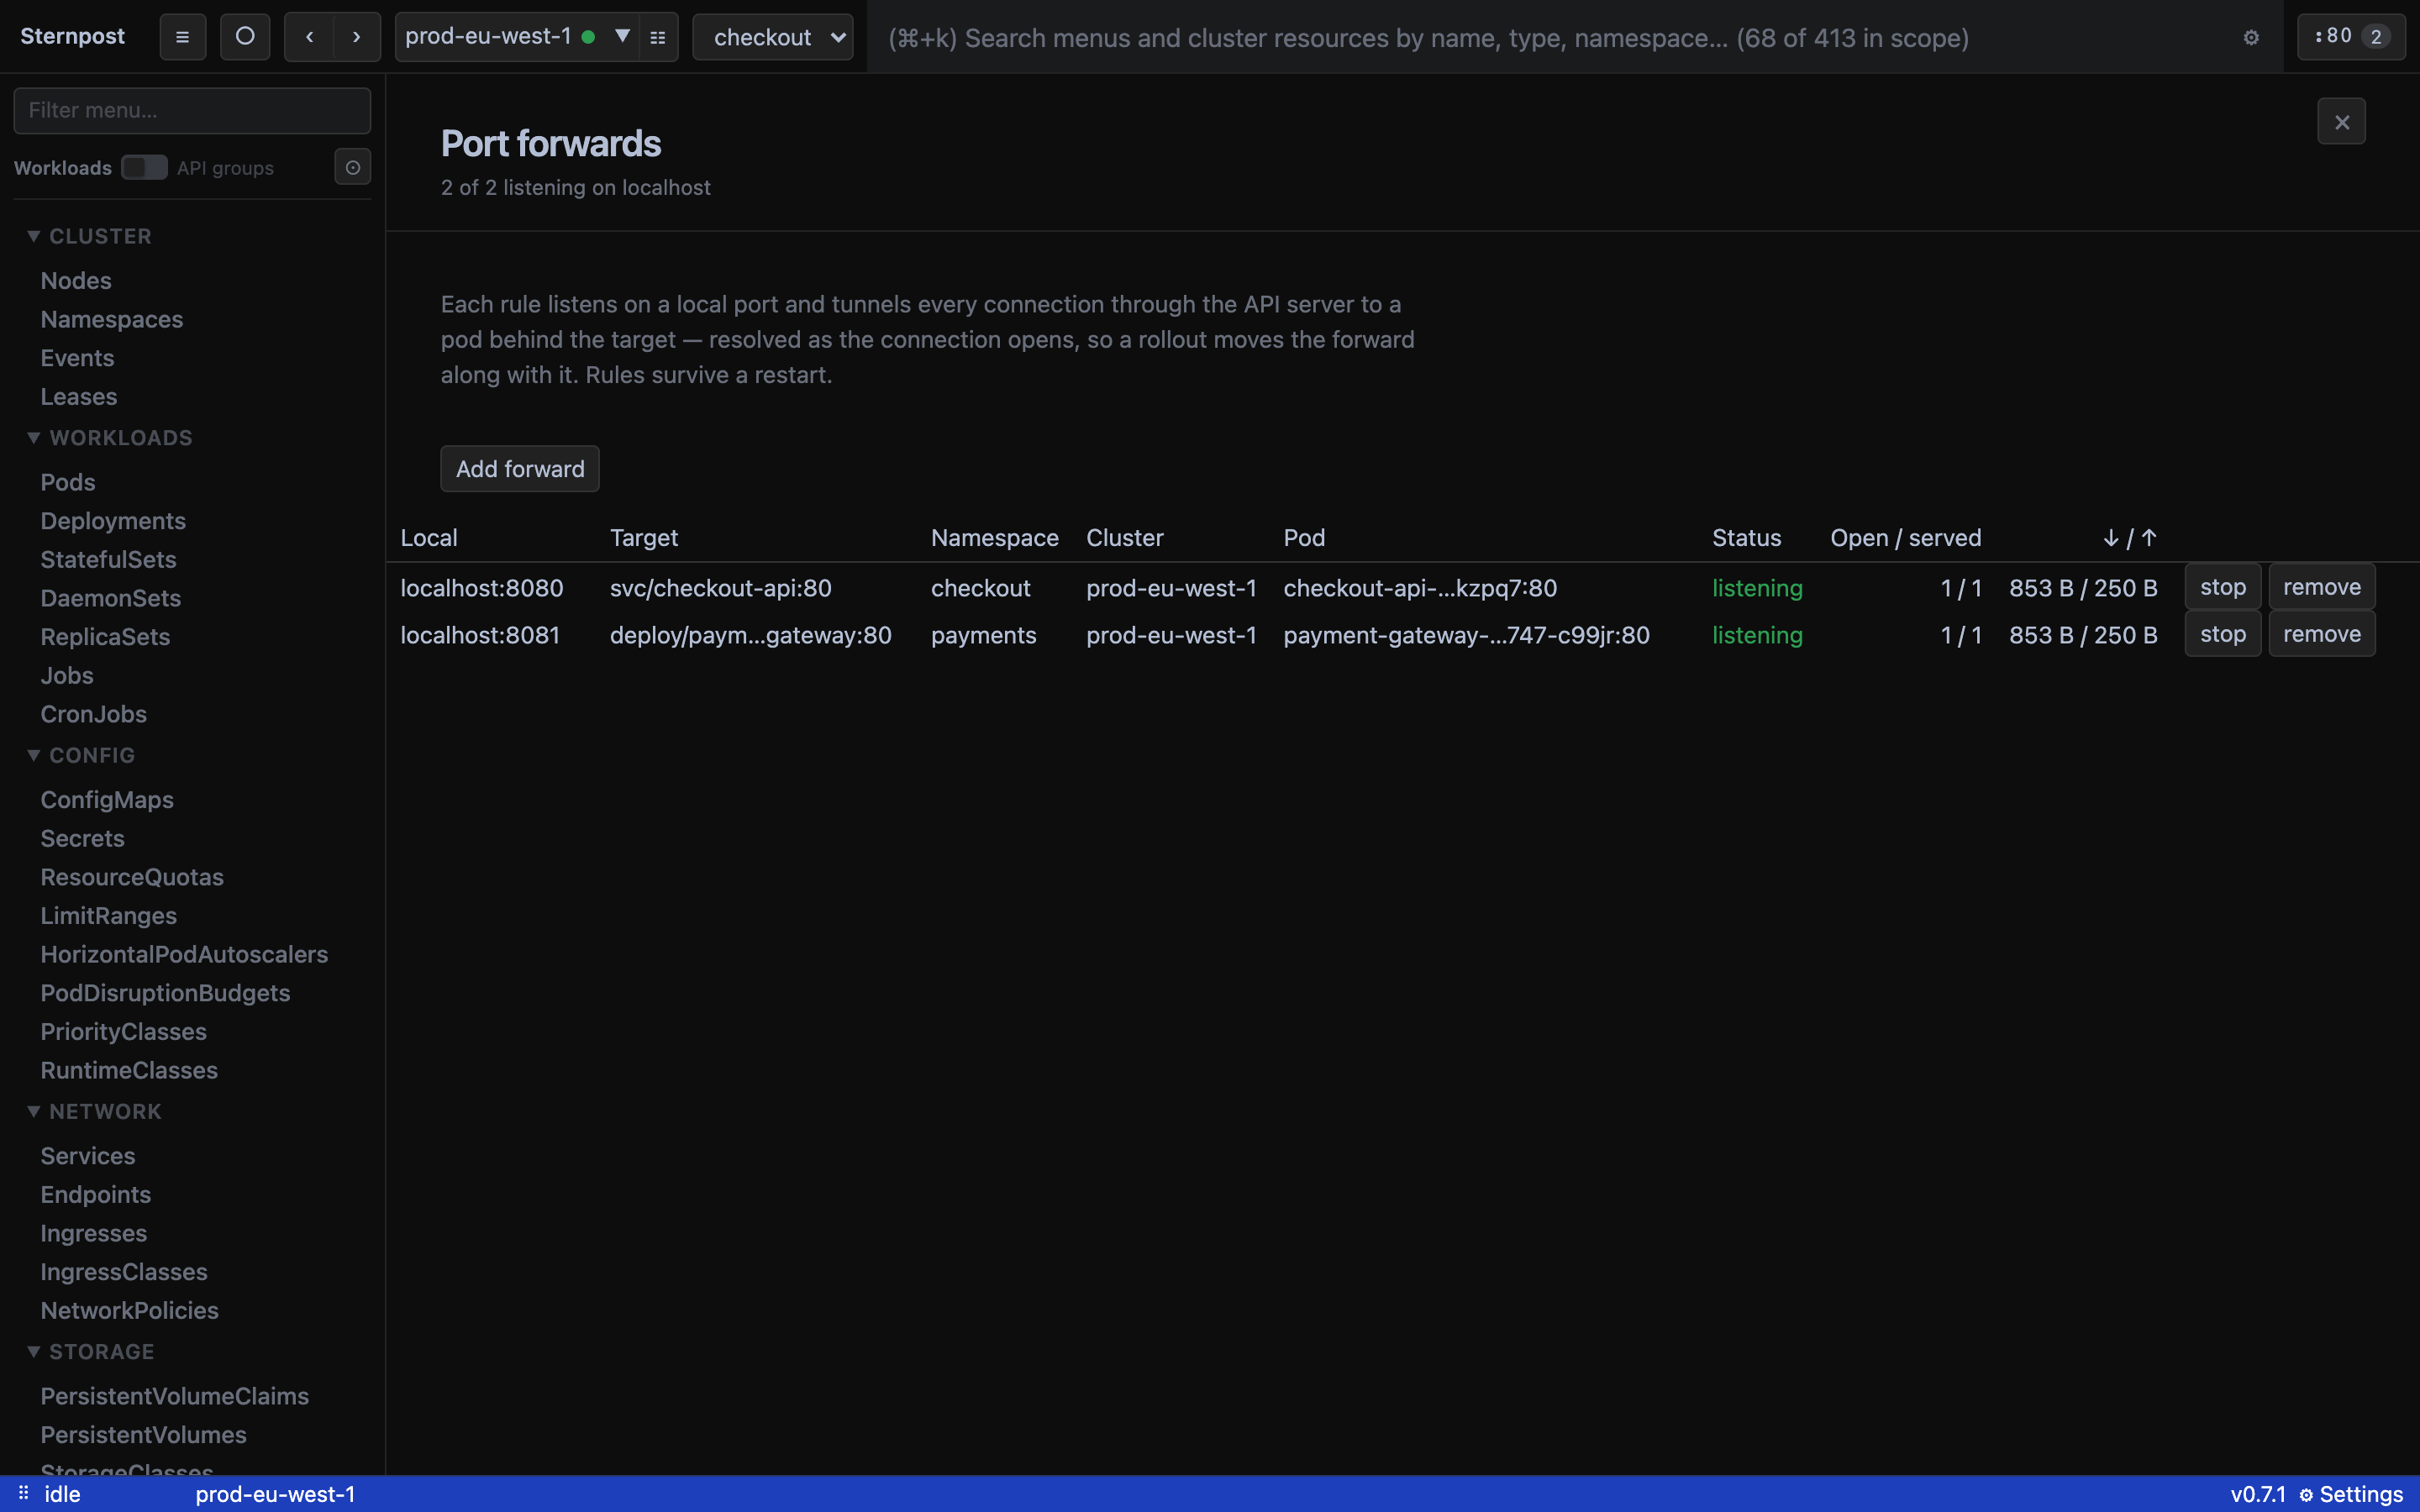
A rule listens on a local port and tunnels each connection through the API server to a Pod, a Service or a workload. Three things neither the CLI nor the desktop clients built on it do:
- The pod is chosen per connection. kubectl port-forward svc/x — and every client that wraps it — picks a pod at start and dies with it. Here a Service's selector is evaluated as each connection opens and a Ready pod is chosen. A rollout costs you only the connections that were open.
- A refused connection is a fact about that connection. The rule stays up and shows the kubelet's own words. Only a rule that can't listen goes red.
- Rules survive a restart. Enabled rules come back when the app does.
- Add one from any workload's page, or from ⌘K: type forward, pick the pod, deployment or service, pick the port.
The number, and what it's a share of.
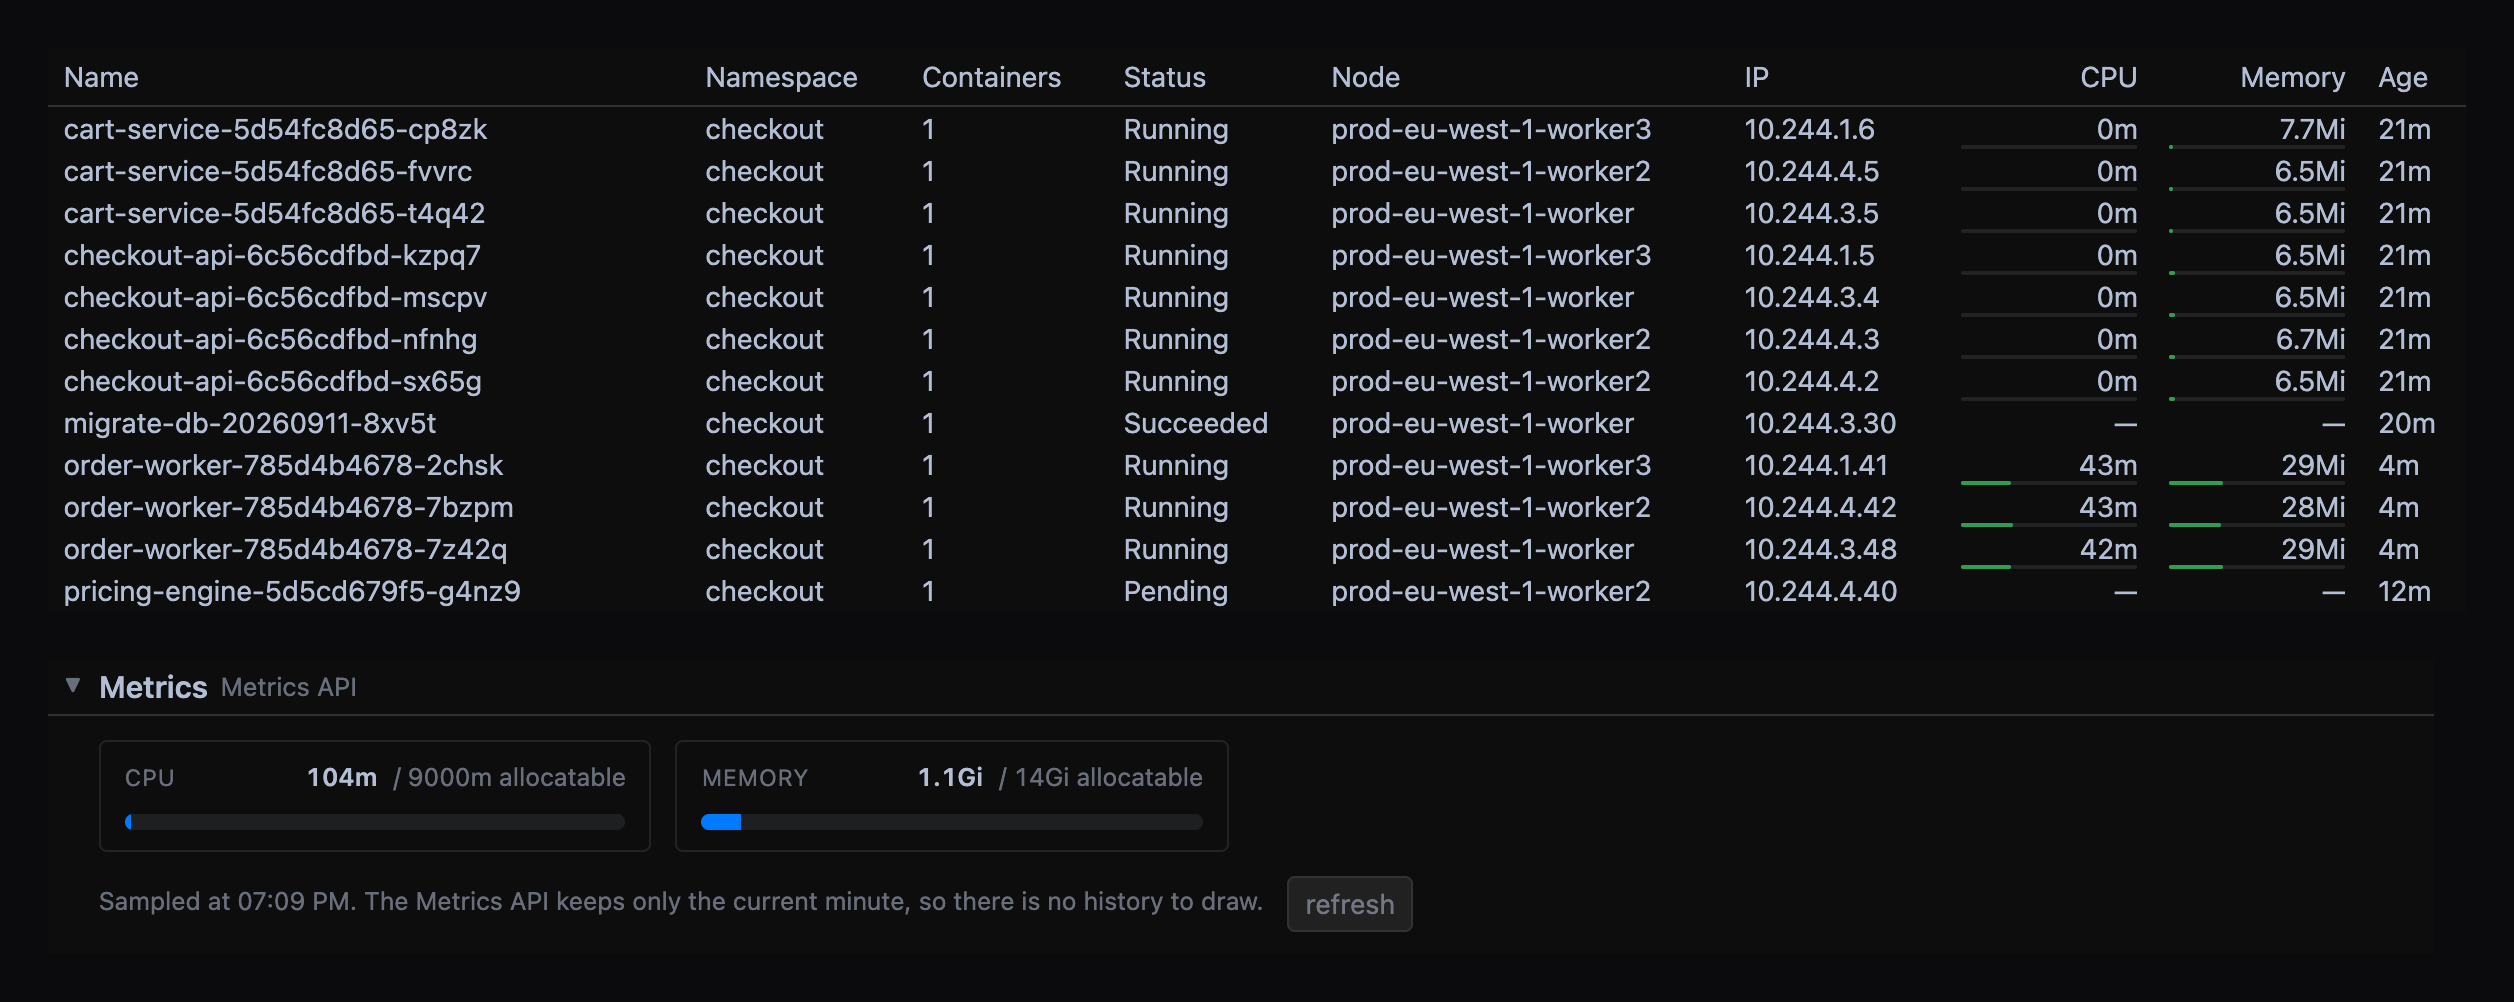
CPU and memory in every pod and node table, printed like kubectl top — with a line under each for its share of the limit (or request, or a node's allocatable). Green under 60%, amber to 90%, red past it. 317Mi says nothing on its own; the line says whether that's a third of the limit or all of it, and says it to peripheral vision down forty rows.
Detail pages get a Metrics section: from Prometheus, thirty minutes of CPU, memory, disk and network with the limit drawn as a line; from metrics-server, a gauge each for CPU and memory. Works with either; if neither is there, the table still renders.
Restart, scale, run now. Confirmed, attributable.
Restart is kubectl rollout restart — the same annotation kubectl uses, so the two don't leave separate marks. Scale shows the change (3 → 5) and won't send the count you're already at. Run now on a CronJob creates a Job the way kubectl create job --from would, named so you can tell it apart in the list.
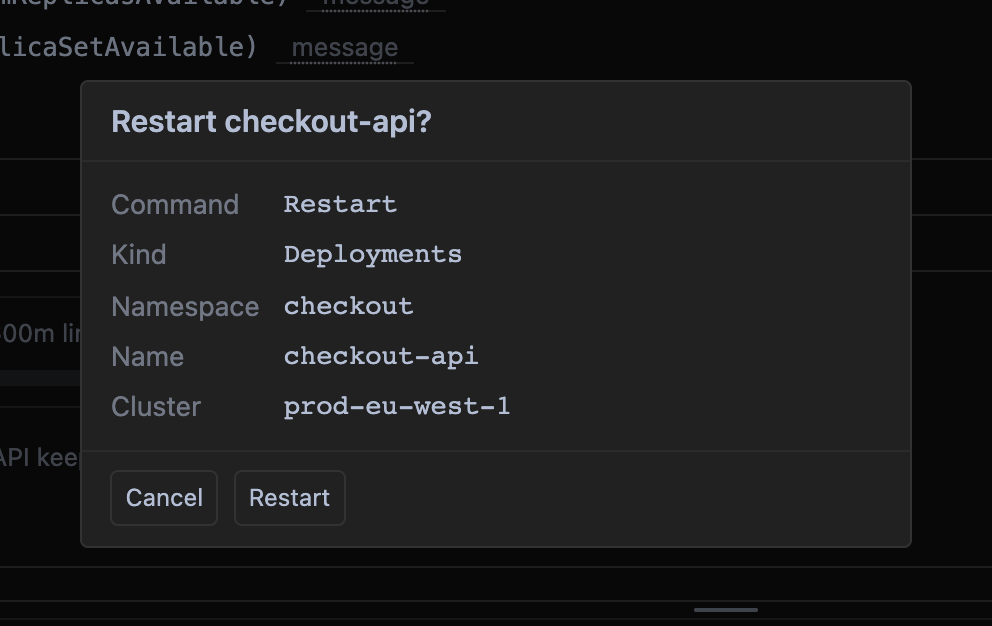
Every action confirms first, in one dialog that recaps cluster, kind, namespace and name. A rollout on production shouldn't be one stray click away. Every write carries fieldManager=sternpost.
Which verbs ⌘K offers is a setting. The buttons next to the thing stay.
⌘K, then the name.
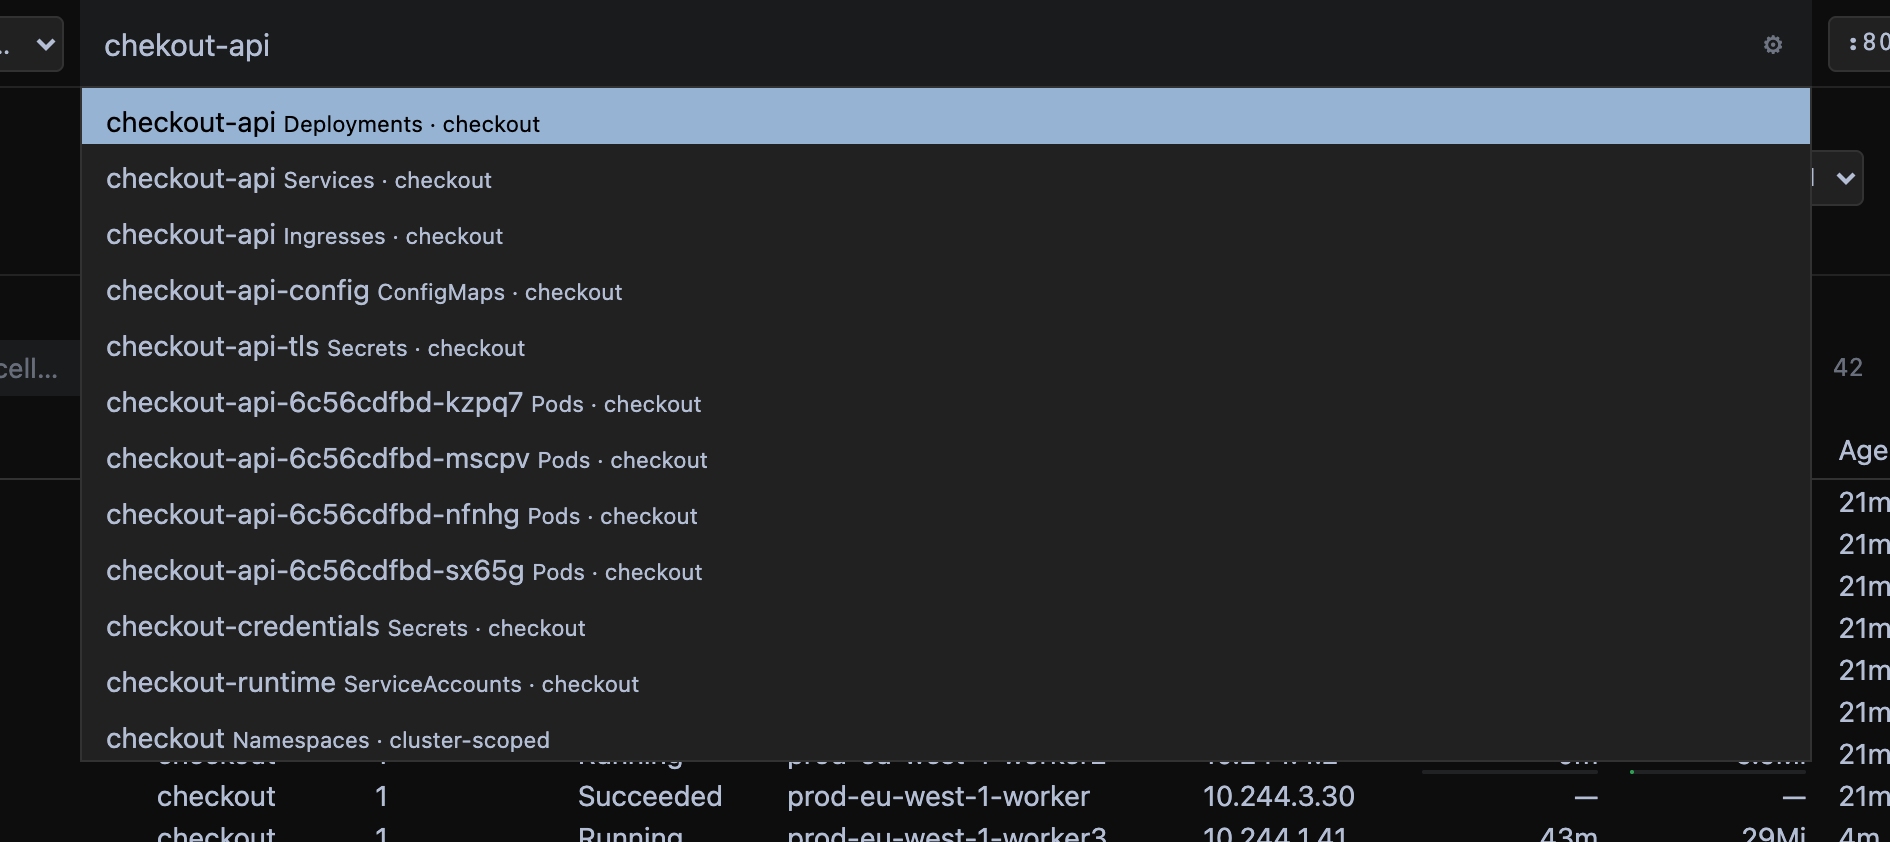
Find a resource by name anywhere in the cluster and jump to it. Fuzzy — smrtkiosk finds smartkiosk-1. Indexed in memory from the watch cache, rebuilt when the cluster changes, not per keystroke.
The same box runs commands: restart, scale, forward a port. Type the verb, pick the target, confirm.
Lists have their own filter over the rows already on screen: substring, regex or fuzzy. A half-typed regex is a message, not a blank page.
Columns that measure themselves.
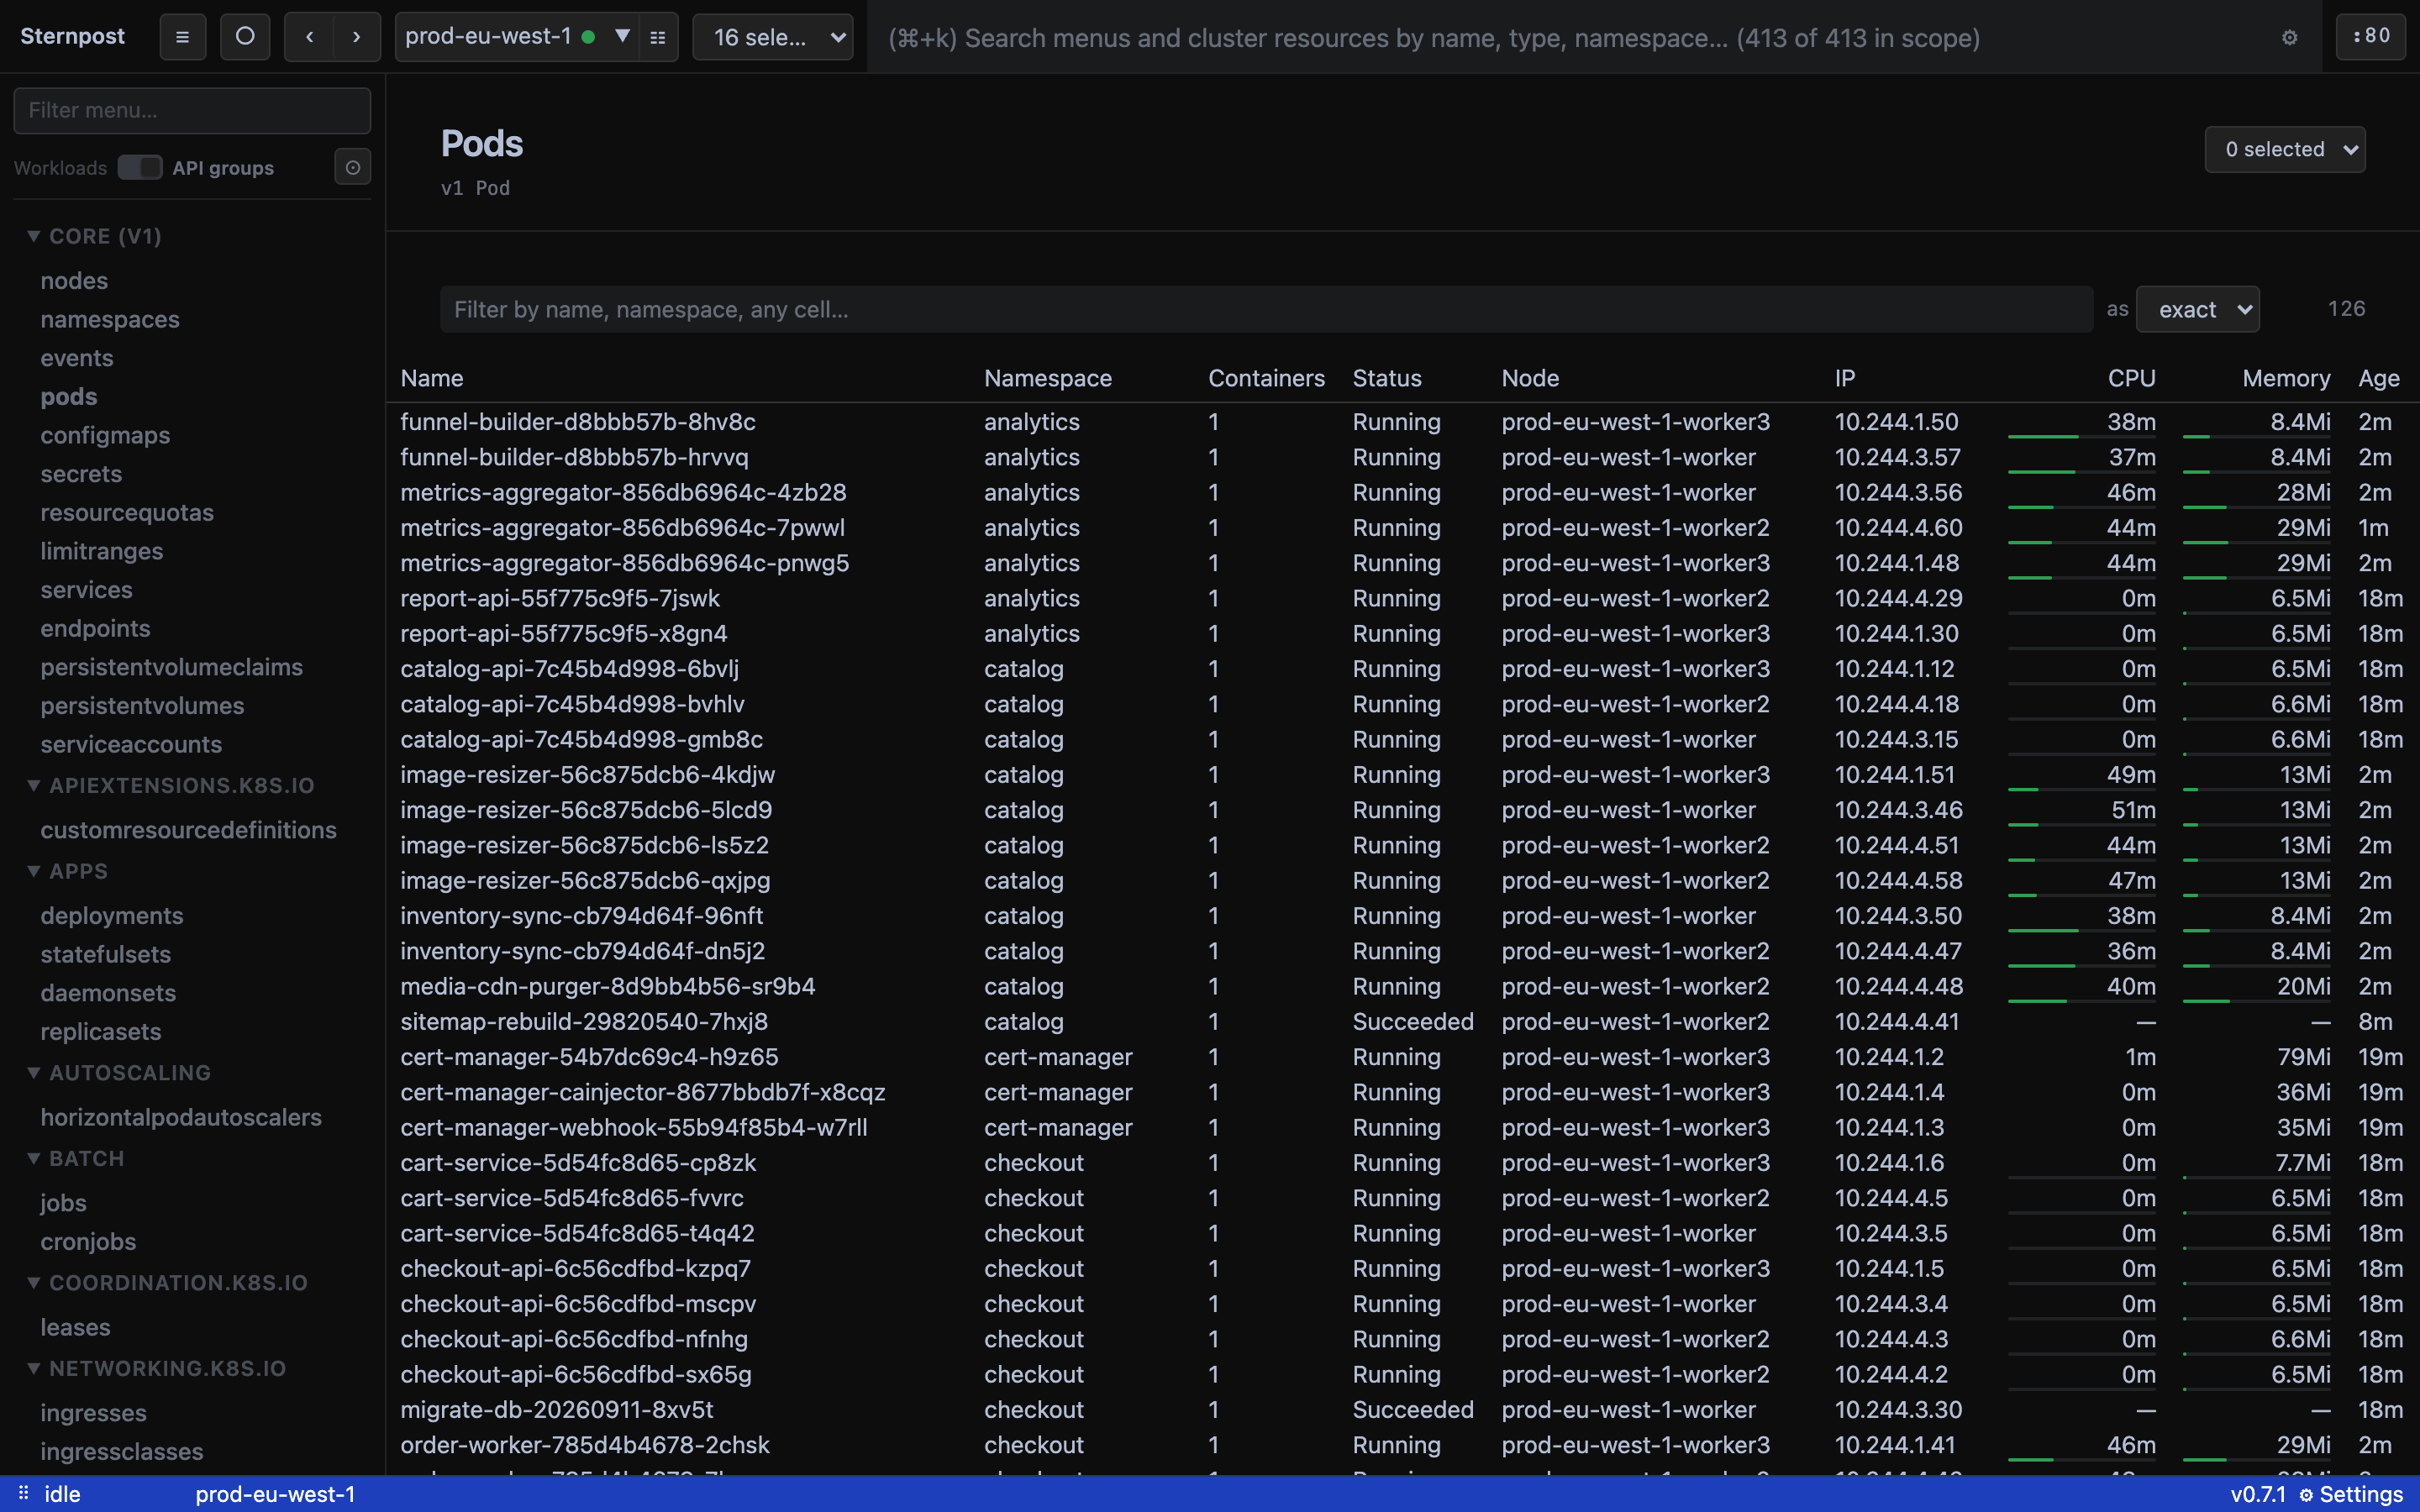
The table looks at what's in each column and sizes it: a column of short statuses is narrow, a column of image names is wide, and nothing wraps mid-word. No horizontal scroll until there genuinely isn't room.
Your kubeconfig, referenced, not copied.
Add a cluster by pointing at a kubeconfig and a context. Sternpost stores the path and the context name — credentials stay in your file. Paste YAML instead and it's written 0600 under the app's data dir and deleted with the cluster.
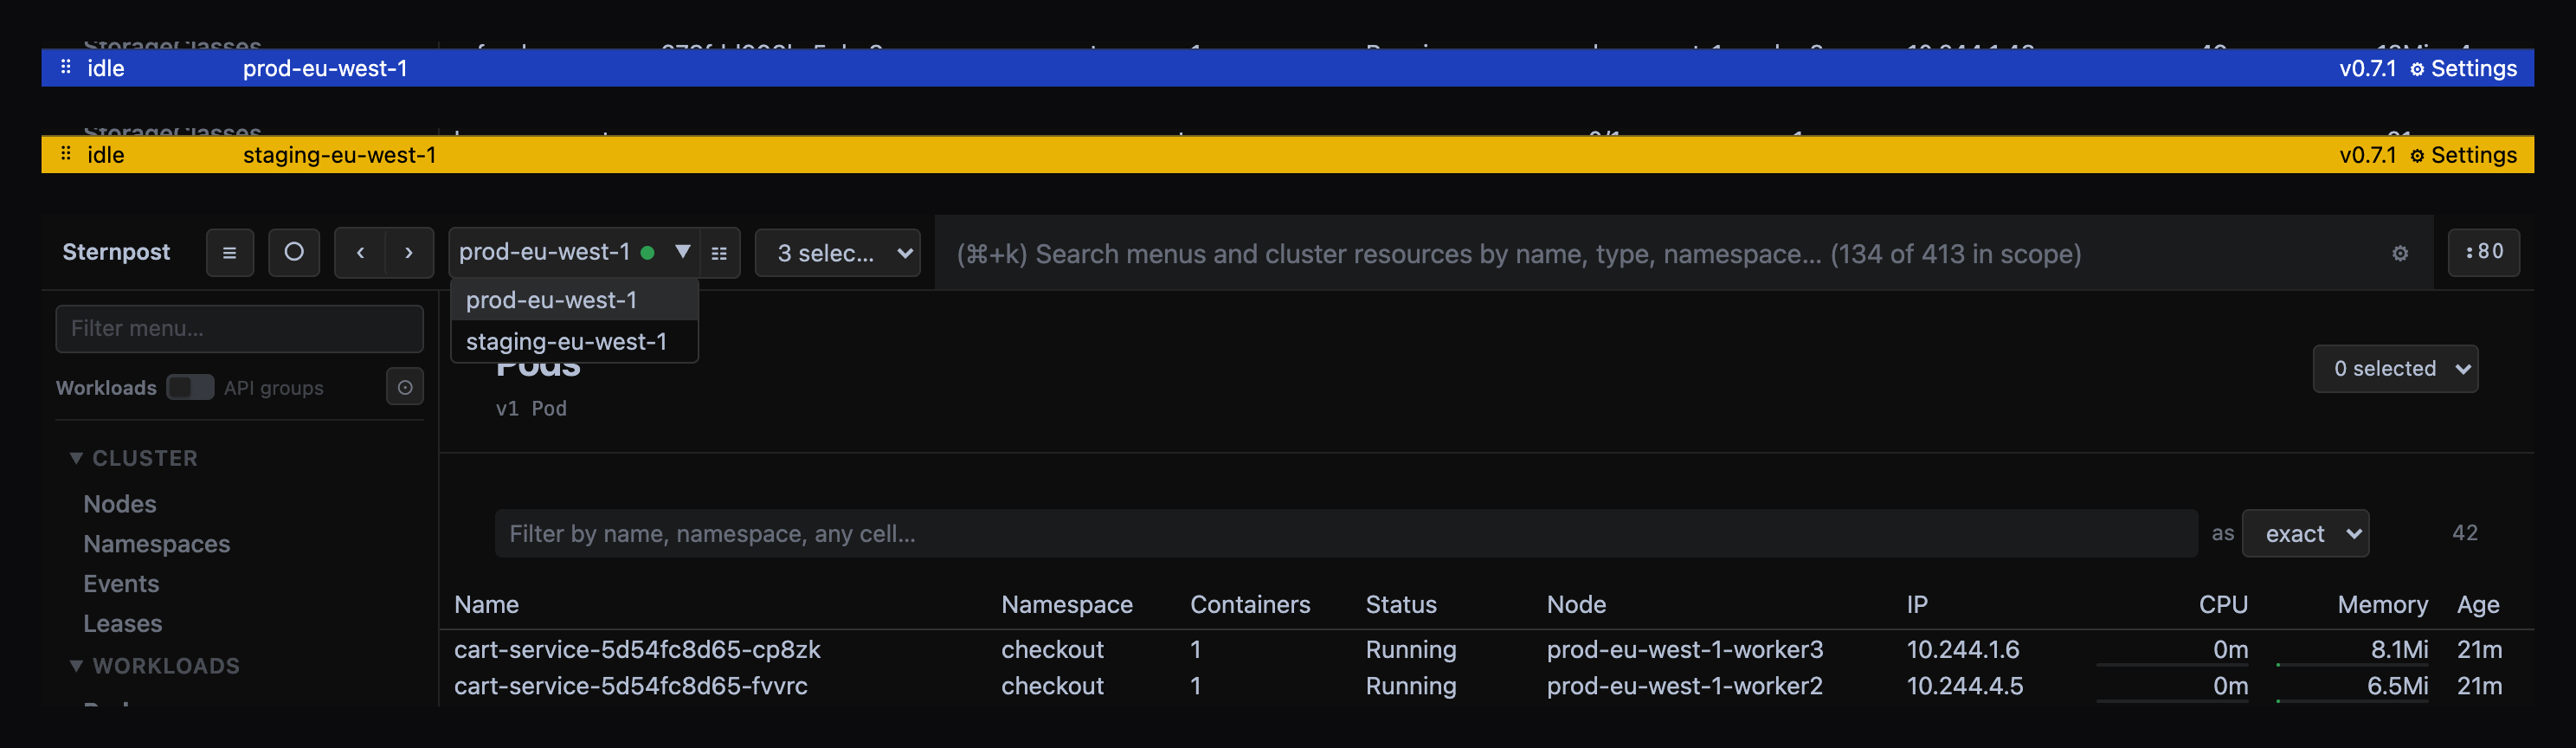
Give each cluster a colour. It tints the status bar so you always know which one you're in, and the contrast is worked out per colour so the text stays readable.
The connectivity dot sits inside the cluster's name, not across the bar from it.
Works for namespace-scoped users.
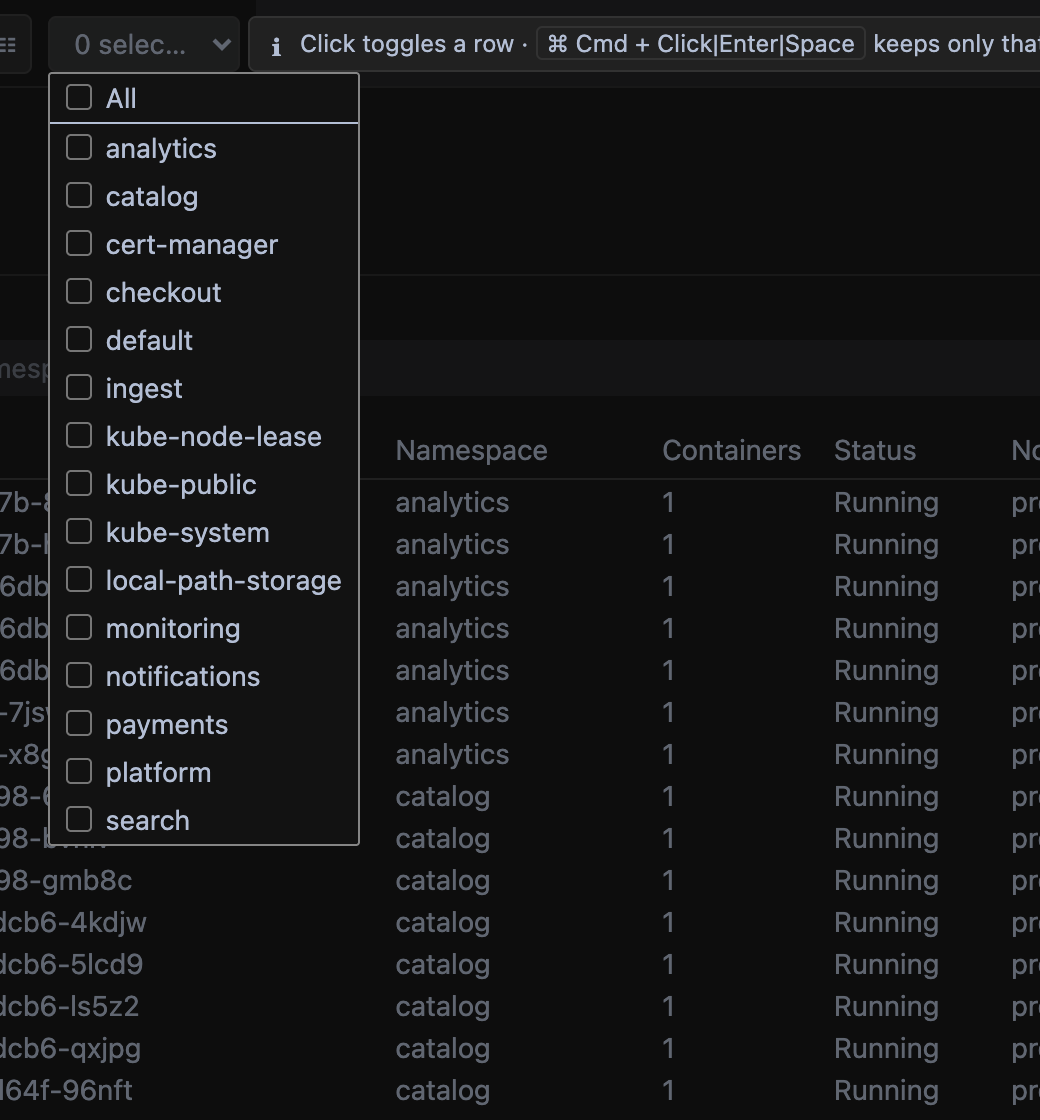
Pick several namespaces and Sternpost makes one scoped request each, in parallel — not one cluster-wide list filtered on your machine. That's what a user without cluster-wide permission can actually do, and it doesn't drag the whole cluster over the wire to show two namespaces. If some are forbidden, you get the rows you can see and a note naming the rest.
What it doesn't do (yet)
- No events on detail pages yet.
- No search inside a log stream.
- Custom resources aren't in ⌘K and aren't watch-backed.
- Port forwards are TCP, loopback, and end when the app quits.
- Lists stop at 10,000 rows and say so.